The Litepresence Report on Cryptocurrency

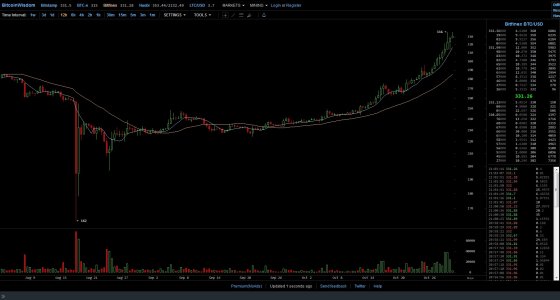
I'm selling the hype and calling this a bubble, the amount it goes over 325 is the amount of insanity in the bitcoin community.

Not a bubble. Healthy correction was due. Got out at 324 see it falling further to 290.

Watch huobi. Downtrending resistance at 2160 now.

Edit: I hope it catches support at 290. Will get in there with a close stop loss. If support is given i can see it going to 500 next.
 
Yeah went back in. Have identified clear OKCoin Channel. Well yeah... clear... hindsight is 20/20 i guess.

OkCoinChannel_zpsrpik0ypl.png


Upper horizontal line is the fake out/blow off top of last july.
The lower horizontal line is the start of the downward cascade down last December.

These guys know how to paint.
 
Last edited:
I'm selling the hype and calling this a bubble, the amount it goes over 325 is the amount of insanity in the bitcoin community.

HOW EDGY

GO BET ON THE MARKET TO BE RATIONAL AND TELL US HOW THAT GOES OR BETTER YET GO PERFORM PHYSICAL IMPOSSIBILITIES UPON THINE SELF
 
The level headed analyst in me says sit it out and wait for the big correction.

The guy who watched the 2013 bull market says otherwise.

Thinking of going back in.
 
A lot of short term traders got rekt in 2013 trying to call the highs and lows. Tread carefully. I prefer just being permabull.
 
A lot of short term traders got rekt in 2013 trying to call the highs and lows. Tread carefully. I prefer just being permabull.

Ya I have the vast majority of my btc locked away in a few vaults - then I have a trading account that I use to try and get more coin.
 
For the record, I went out again at 2180. Too many little hops. Seems like a good choice. Let's see what happens at 2125 if it goes there.

Well, that was a sweet trade at 2125! 5 min later and over 2160.
 
Last edited:
H7fZJdK.png


365 day volume weighted average price


Code:
import numpy as np
import talib as ta
import time as t

DEPTH = 365*86400/info.interval
PAIR = info.primary_pair

def initialize():
    storage.reset()
    log('storage.reset()')
    storage.start = storage.get('start', t.time())

def deep_candles(depth):
    
    storage.deep_c = storage.get('deep_c', [])
    storage.deep_v = storage.get('deep_v', [])
    
    if info.tick==0:
        for x in range(depth):
            n = depth - x 
            storage.deep_c.append(float(data[PAIR][-n].close))
    else:
        storage.deep_c.append(float(data[PAIR].close))
        
    if info.tick==0:
        for x in range(depth):
            n = depth - x 
            storage.deep_v.append(float(data[PAIR][-n].volume))
    else:
        storage.deep_v.append(float(data[PAIR].volume))        
    storage.deep_c=storage.deep_c[-depth:]
    storage.deep_v=storage.deep_v[-depth:]    
    return np.array(storage.deep_c) , np.array(storage.deep_v)
    
def tick():
    
    c,v = deep_candles(DEPTH)
    #plot('deep_c', c[-1])
    plot('deep_v', v[-1], secondary=True)

    z = sum(c*v)/sum(v[-len(v):])  

    plot('365vwap', z)
    
    if info.tick == (info.max_ticks-1):
        log('365 VWAP...: %.2f' % z)
        log('price......: %.2f' % c[-1])
    
def stop():
    
    log('elapsed....: %.1f sec' % (t.time()-storage.start))
 
Last edited:
The 12-hr chart appears rally hasn't really missed a beat. If it really is a blow-off top forming, it doesn't seem to have hit that extreme overbought top yet.

attachment.php
 

Attachments

  • lPOGcVx.jpg
    lPOGcVx.jpg
    225.3 KB · Views: 0
Last edited:
pf2XUgk.png


log scale view back to dawn of bitcoin on 365 day vwap.

it is currently crossed bull on price; and it is currently just barely positive slope for the first time since nov 2014

365vwap is 260.56 last
 
pf2XUgk.png


mt gox and btce composite image


log scale view back to dawn of bitcoin on 365 day vwap.

it is currently crossed bull on price; and it is currently just barely positive slope for the first time since nov 2014

365vwap is 260.56 last
 
This rise is VERY REAL.

major pivot points

365 day cross

90/150 12h cross


I'll put a bold prediction out there for


$1500 / BTC Christmas
 
The Wyckoff P&F horizontal count puts the ultimate target at $700-800. Seems crazy. But that's what 9 months of accumulation does... coils the market like a spring.

YES I CAN ONLY IMAGINE HOW MANY WHALES OUT THERE HAVE BEEN WAITING ALL THIS TIME FOR $300 COIN
 
Yeah went back in. Have identified clear OKCoin Channel. Well yeah... clear... hindsight is 20/20 i guess.

OkCoinChannel_zpsrpik0ypl.png


Upper horizontal line is the fake out/blow off top of last july.
The lower horizontal line is the start of the downward cascade down last December.

These guys know how to paint.

This channel is still very much in play after a magnificent check at 2125.
Current rising support at 2160, rising resistance at 2440. Lots of upside, small downside.
Sell at own risk!
 
$1500 is bold indeed, but not out of the question if this keeps up and bulls take control.

I'm taking a break for a few days to book profits, made bank in futures on this rise and don't want to lose it by overtrading. Earlier I bought some Xmas futures (yes they expire on 12/25) but panic sold them back while looking at the daily chart. I mean, it's ridiculous. Every time people start thinking that it's different this time, it usually isn't. But I'd love to be proven wrong. The way I see it's either going to come down hard or be the start of something big.
 
Back
Top