You are using an out of date browser. It may not display this or other websites correctly.
You should upgrade or use an alternative browser.
You should upgrade or use an alternative browser.
The Litepresence Report on Cryptocurrency
- Thread starter presence
- Start date
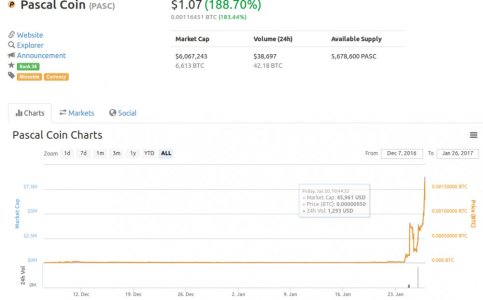
anyone got the hype on pascal?
massive entry spike for an ICO
Someone was talking to me about it last month, I thought it was silly. It was in pascal, so what? Oops, maybe I should do the opposite of what I think

presence
Member
- Joined
- Dec 20, 2011
- Messages
- 19,330
so I did a bit of reading on pascal
seems to be 100% hype upon entry to polo pump dump situation
I don't see anything remarkable in the tech beyond the language
I did read something about how 80% of the existing coins are held by a single party on bitcoin talk... unverified
don't be a bag holder
seems to be 100% hype upon entry to polo pump dump situation
I don't see anything remarkable in the tech beyond the language
I did read something about how 80% of the existing coins are held by a single party on bitcoin talk... unverified
don't be a bag holder
presence
Member
- Joined
- Dec 20, 2011
- Messages
- 19,330
China Bans Margin Trading
Chinese Central Bank turns attention to bitcoin exchanges; Price ...
Brave New Coin-12 hours ago
Actions of Chinese Government May Reduce Bitcoin Volatility ...
newsBTC-22 hours ago
Fake Volume DEAD on chinese exchanges since China Crackdown
OKCOIN
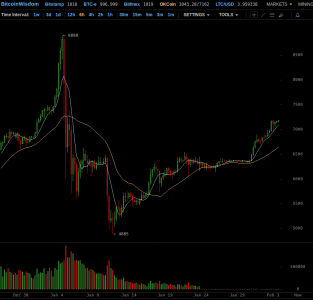
BTCCHINA
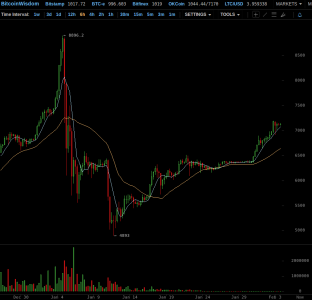
HUOBI
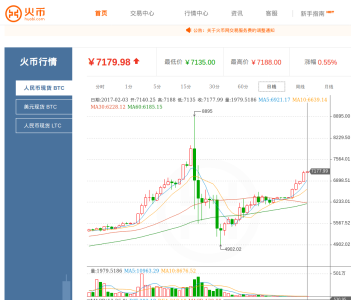
Last edited:
fatjohn
Member
- Joined
- Jan 17, 2008
- Messages
- 2,285
Yeah well nobody disputes that there was fake volume. There is however also true volume. The true volume shows that each of the three Chinese exchanges are roughly as big as bitfinex on BTC trading. All trade about 10k/day.
On LTC trading though OKCoin has for the week 2,5 Million LTC trades! Huobi probably similarly, for comparison BTC-e still has the biggest LTC/USD margin and did not account for even 0.5 million trades. China is easily 5 times bigger than the US on LTC trading.
From this the BTC/fiat trade is lower than 100k/day while the LTC/fiat trade is probably around 1M/day. This while there are only 3 times as many LTC as BTC.
The velocity of the LTC market is 3 times as high.
Add to this the hype that segwit might give, the all time low that was hit earlier today, the fact that bitcoin is very slow and litecoin incredibly fast concerning confirmation time and the following graph and I am incredibly bullish. (We are in the red circle, the rest is just an extrapolation.)
 [/URL][/IMG]
On LTC trading though OKCoin has for the week 2,5 Million LTC trades! Huobi probably similarly, for comparison BTC-e still has the biggest LTC/USD margin and did not account for even 0.5 million trades. China is easily 5 times bigger than the US on LTC trading.
From this the BTC/fiat trade is lower than 100k/day while the LTC/fiat trade is probably around 1M/day. This while there are only 3 times as many LTC as BTC.
The velocity of the LTC market is 3 times as high.
Add to this the hype that segwit might give, the all time low that was hit earlier today, the fact that bitcoin is very slow and litecoin incredibly fast concerning confirmation time and the following graph and I am incredibly bullish. (We are in the red circle, the rest is just an extrapolation.)

no see.
presence
Member
- Joined
- Dec 20, 2011
- Messages
- 19,330
presence
Member
- Joined
- Dec 20, 2011
- Messages
- 19,330
POLO EXTINCTION EVENT v1.0
Open Source Backtest Engine for Poloniex.com
http://pastebin.com/mnMCvycQ


Open Source Backtest Engine for Poloniex.com
http://pastebin.com/mnMCvycQ


Code:
# Jan 2017
# submit script bunny tithing obligations below:
# (BTC) 1Hu7mVg4GudEcnRLN94oWC9Umh4JohNp3F
# custom bots, any technical indication [email protected]
# dependencies: python 2.7, matplotlib 1.3.1, python-tk
import matplotlib.pyplot as plt
import numpy as np
import urllib2
import json
import math
import time
VERSION = 'POLO EXTINCTION EVENT v1.0 by litepresence'
# PAIR
CURRENCY = 'BTC'
ASSET = 'FLDC'
# ALPHA CROSS (DAYS)
MA1 = 16.66
MA2 = 50.00
# STATE MACHINE THRESHOLDS
SELLOFF = 1.5
DESPAIR = 0.75
CROSS = 1.02
# BACKTEST RESOLUTION
CANDLE = 14400
DAYS = 650
END = 9999999999 #9999999999 is to current; else unix
# STARTING PORTFOLIO
portfolio = {}
portfolio['assets'] = 0
portfolio['currency'] = 1
# INITIALIZED STORAGE VALUES
storage = {}
storage['trades'] = 0
# INFO OBJECTS
info = {}
info['begin'] = int(time.time())-DAYS*86400
info['tick'] = 0
info['interval'] = CANDLE
info['current_time'] = info['begin']
info['end']=info['begin']+DAYS*86400
# BACKTEST CONSTANTS
DEPTH = int(max(MA1,MA2)*(86400/CANDLE)+50)
START = info['begin']-(CANDLE*DEPTH)
SATOSHI = 0.00000001
ANTISAT = 100000000.0
def initialize():
print(VERSION)
print('~===BEGIN BACKTEST=======================~')
if info['interval'] not in [300, 900, 1800, 7200, 14400, 86400]:
print ('Tick Interval must be in [300, 900, 1800, 7200, 14400, 86400]')
raise stop()
def test_sell(price):
now = time.ctime(info['current_time'])
portfolio['currency'] = portfolio['assets']*price
print ('[%s] %s SELL %.2f %s at %s sat value %.2f %s' % (now,
storage['trades'], portfolio['assets'], ASSET, int(price)/SATOSHI,
portfolio['currency'], CURRENCY))
portfolio['assets'] = 0
plt.plot(info['current_time'],math.log(price),markersize=8,
marker='o',color='coral',label='sell')
def test_buy(price):
now = time.ctime(info['current_time'])
portfolio['assets'] = portfolio['currency']/(price)
print ('[%s] %s BUY %.2f %s at %s sat value %.2f %s' % (now,
storage['trades'], portfolio['assets'], ASSET, int(price)/SATOSHI,
portfolio['currency'], CURRENCY))
portfolio['currency'] = 0
plt.plot(info['current_time'],math.log(price),markersize=8,
marker='o',color='lime',label='buy')
def fetch_polo():
candles={}
asset = ASSET
polo = asset + '_polo'
candles[polo] = {}
url = ('https://poloniex.com/public?command=returnChartData' +
'¤cyPair=%s_%s&start=%s&end=%s&period=%s' %
(CURRENCY,asset,START,END,CANDLE))
ret = urllib2.urlopen(urllib2.Request(url))
try: candles[polo] = json.loads(ret.read())
except: pass
print('*********%s%s*********'% (asset,CURRENCY))
print('DEPTH......: %s' % len(candles[polo]))
print('CANDLE.....: %s' % CANDLE)
print('START DATE.: %s' % time.ctime(info['begin']))
print('END DATE...: %s' % time.ctime(info['end']))
print('1st CANDLE.: %s' % str(candles[polo][-(DAYS*86500/CANDLE)])[:200])
print('LAST CANDLE: %s' % str(candles[polo][-1])[:200])
storage[polo]={}
storage[polo]['date']=[]
storage[polo]['close'] = []
storage[polo]['high'] = []
storage[polo]['low'] = []
for i in range(len(candles[polo])):
storage[polo]['date'].append(candles[polo][i]['date'])
storage[polo]['close'].append(candles[polo][i]['close'])
storage[polo]['high'].append(candles[polo][i]['high'])
storage[polo]['low'].append(candles[polo][i]['low'])
def build_polo_candles():
# allow (for asset in ASSET:) for multiple pairs
asset = ASSET
polo = asset + '_polo'
polo_close = asset + '_polo_close'
polo_high = asset + '_polo_high'
polo_low = asset + '_polo_low'
for i in range(len(storage[polo]['date'])):
if (info['current_time'] <=
storage[polo]['date'][i] <
(info['current_time']+info['interval'])):
storage[polo_close] = []
storage[polo_high] = []
storage[polo_low] = []
for j in range(DEPTH):
try:
storage[polo_close].append(storage[polo]['close'][i-j])
storage[polo_high].append(storage[polo]['high'][i-j])
storage[polo_low].append(storage[polo]['low'][i-j])
except: pass
storage[polo_close] = storage[polo_close][::-1]
storage[polo_high] = storage[polo_high][::-1]
storage[polo_low] = storage[polo_low][::-1]
storage['close'] = np.array(storage[polo_close])
storage['high'] = np.array(storage[polo_high])
storage['low'] = np.array(storage[polo_low])
def simple_mean():
# CALCULATE SIMPLE MOVING AVERAGES
close = storage['close']
ma1_interval = int(MA1*86400/info['interval'])
ma2_interval = int(MA2*86400/info['interval'])
storage['ma1'] = np.sum(close[-ma1_interval:]) / len(close[-ma1_interval:])
storage['ma2'] = np.sum(close[-ma2_interval:]) / len(close[-ma2_interval:])
def holdings():
# STORE STARTING PORTFOLIO
close = storage['close']
if info['tick']==0:
storage['begin_max_assets']=(
portfolio['currency']/(close[-1])+portfolio['assets'])
storage['begin_max_currency']=(
portfolio['currency']+portfolio['assets']*(close[-1]))
storage['start_price'] = close[-1]
def tick():
build_polo_candles()
holdings()
simple_mean()
state_machine()
chart()
def state_machine():
# SAMPLE MOVING AVERAGE CROSSOVER STRATEGY
# YOUR STRATEGY GOES HERE:
# LOCALIZE DATA
ma1 = storage['ma1']
ma2 = storage['ma2']
close = storage['close']
high = storage['high']
low = storage['low']
# ALPHA SIGNAL
market_cross = False
if 1.03*ma1>ma2:
market_cross = True
# STATE MACHINE - BULL MARKET
mode = 0
if market_cross:
mode = 10
if portfolio['currency'] > 0:
if storage['close'][-1]<ma1:
test_buy(price=storage['close'][-1])
storage['trades']+=1
# STATE MACHINE - BEAR MARKET
else:
mode = -10
if portfolio['assets'] > 0:
if storage['close'][-1]>ma1:
test_sell(price=storage['close'][-1])
storage['trades']+=1
storage['mode']=mode
def chart():
# LOCALIZE DATA
now = info['current_time']
ma1 = storage['ma1']
ma2 = storage['ma2']
close = storage['close']
high = storage['high']
low = storage['low']
mode = storage['mode']
# PLOT OBJECTS
plt.plot(now,math.log(ma1),markersize=1,marker='.',
color='white',label='ma1')
plt.plot(now,math.log(ma2),markersize=2,marker='.',
color='white',label='ma2')
plt.plot(now,math.log(close[-1]),markersize=1,marker='.',
color='aqua',label='close')
plt.plot(now,math.log(high[-1]),markersize=1,marker='.',
color='MediumSpringGreen',label='high')
plt.plot(now,math.log(low[-1]),markersize=1,marker='.',
color='darkmagenta',label='low')
def plot():
# PLOT FORMAT
try:
ax = plt.gca()
ax.set_axis_bgcolor('0.1')
ax.yaxis.tick_right()
ax.set_xlim(info['begin'], info['end'])
ax.get_xaxis().get_major_formatter().set_useOffset(False)
ax.get_xaxis().get_major_formatter().set_scientific(False)
ax.ticklabel_format(useOffset=False, style='plain')
ax.grid(True)
plt.autoscale(enable=True, axis='y')
#plt.autoscale(enable=True, axis='x')
plt.gcf().autofmt_xdate(rotation=90)
plt.title(VERSION+'PAIR: %s_%s' %
(ASSET, CURRENCY))
plt.tight_layout()
except:
print('plot format failed')
pass
# SHOW PLOT
try:
plt.show()
plt.pause(0.1)
except:
print('plot show failed')
def stop():
# MOVE TO CURRENCY
if portfolio['assets'] > 0:
print('stop() EXIT TO CURRENCY')
test_sell(price=storage['close'][-1])
# CALCULATE RETURN ON INVESTMENT
end_max_assets=(
portfolio['currency']/(storage['close'][-1])+portfolio['assets'])
end_max_currency=(
portfolio['currency']+portfolio['assets']*(storage['close'][-1]))
roi_assets = end_max_assets/storage['begin_max_assets']
roi_currency = end_max_currency/storage['begin_max_currency']
# FINAL REPORT
print('===============================================================')
print('START DATE........: %s' % time.ctime(info['begin']))
print('END DATE..........: %s' % time.ctime(info['end']))
print('START PRICE.......: %s satoshi' % ANTISAT*int(storage['start_price']))
print('END PRICE.........: %s satoshi' % ANTISAT*int(storage['close'][-1]))
print('START MAX ASSET...: %.2f %s' % (storage['begin_max_assets'],ASSET))
print('END MAX ASSET.....: %.2f %s' % (end_max_assets,ASSET))
print('ROI ASSET.........: %.1fX' % roi_assets)
print('START MAX CURRENCY: %.2f %s' % (storage['begin_max_currency'],CURRENCY))
print('END MAX CURRENCY..: %.2f %s' % (end_max_currency, CURRENCY))
print('ROI CURRENCY......: %.1fX' % roi_currency)
print('===============================================================')
print(VERSION)
print('~===END BACKTEST=========================~')
# PRIMARY EVENT LOOP
initialize()
fetch_polo()
while 1:
if info['current_time'] < info['end']:
info['current_time']+=CANDLE
tick()
info['tick']+=1
else:
stop()
plot()
breakroteiro
Member
- Joined
- Jan 18, 2015
- Messages
- 13
Thanks a lot for the information, it is really interesting for me! Which service do you guys usually use for buying Bitcoin? I want to try out the one at https://www.xmlgold.eu/ What do you think about it? Looks nice to me
Last edited:
FSP-Rebel
Mr. Republitarian
- Joined
- May 19, 2007
- Messages
- 11,528
Bitcoin Mentioned For First Time Ever During The Super Bowl
https://bitconnect.co/bitcoin-news/429/bitcoin-mentioned-for-first-time-ever-during-the-super-bowl/
https://bitconnect.co/bitcoin-news/429/bitcoin-mentioned-for-first-time-ever-during-the-super-bowl/
presence
Member
- Joined
- Dec 20, 2011
- Messages
- 19,330
presence
Member
- Joined
- Dec 20, 2011
- Messages
- 19,330
Two of China's Biggest Exchanges Stop Bitcoin Withdrawals - CoinDesk
www.coindesk.com › Huobi
2 hours ago
Chinese bitcoin exchanges says to strengthen scrutiny of customers ...
2 hours ago -

www.coindesk.com › Huobi
2 hours ago
Two of China's most widely used bitcoin exchanges
have announced that they will
suspend bitcoin and litecoin withdrawals
for one month effective immediately.
Yuan recharge, withdrawals and other services will not be affected, the exchanges said.
In public posts that showcase the increasingly coordinated nature of exchange policy in the region, both OKCoin and Huobi said today that the move was a bid to bolster their anti-money laundering (AML) capabilities and prevent "illegal transactions".
Both OKCoin and Huobi indicated that their platforms would now go through an “upgrade” to combat “money laundering, exchange, pyramid schemes and other illegal activities”, though no further details were provided.
BTCC, the other ‘Big Three’ domestic exchange, did not issue the update.
All told, the move comes amid a rocky period for local exchanges that began with the wider scrutiny of major bitcoin exchanges by the People's Bank of China (PBOC), the country's central bank.
Earlier today, China's central bank issued a warning to domestic exchanges, going so far as to state it would move to shutter startups that violated its guidance through the necessary government channels.
In statements provided to CoinDesk, Huobi indicated that the move was a proactive one that found the two exchanges seeking to "promote bitcoin industry self-discipline".
Chinese bitcoin exchanges says to strengthen scrutiny of customers ...
2 hours ago -

Last edited:
Communism is anti-freedom & crypto
LibertyTeeth
Member
- Joined
- Mar 22, 2014
- Messages
- 22
Just made 37% on a pair of trades, FLDC and MAID, over a period of a week and a half or so. The latter was more profitable, but I thank Litepresence for alerting me to the FLDC.
Similar threads
- Replies
- 2
- Views
- 61
- Replies
- 57
- Views
- 7K
- Replies
- 2
- Views
- 1K

